Node ExporterではNTP情報も出力できるということになっている。起動オプションで ntp関係の指定をするだけ。
ただ、このNTP情報は参照する時刻ソースを見てくれないみたい。できたらNTPサーバの統計情報でいうところのpeerstatsを取りたい。
また、Node ExporterのNTP情報用のテンプレートが提供されているが、こちらは参照するホストの選択と表示がどうなっているのかわからない。監視対象に複数台のNTPサーバがいてそれぞれNode ExporterでNTP情報を出力した場合に表示が変なのでどう使ってよいのか良くわからない。
ntpdが出力する統計情報を使用すれば、欲しい情報は取れるわけなのでそれをNode Exporterに渡してGrafanaで表示することにした。これ、以前のElastic Stackのよりもはるかに簡単。
なお、ブログの1ページでやるにはいろいろあり過ぎるので「がとらぼ」ではpeerstatsだけを対象とする。
ntpdに統計情報を出力させる
/etc/ntp.conf (変更 or 5行挿入)1 2 3 4 5 | statistics loopstats peerstats clockstats sysstats
statsdir /var/lib/ntp/ntpstats/
filegen peerstats file peerstats type day enable
filegen loopstats file loopstats type day enable
filegen clockstats file clockstats type day enable
|
2行目は統計ファイルの出力先
このとき、Linuxのsystemd系のシステムではNTPの起動設定ファイルに注意。privatetempが有効にされていると統計ファイルが何処に出力されるのか判らないということも。/lib/systemd/system/ntp.serviceファイルのprivatetemp行を削除してNTPサービスを停止→無効化→最有効化・開始する。(全てのディストリビューションでこの通りとは限らないかも)
NTPの再起動#Linuxの場合 % sudo service ntp restart #FreeBSDの場合 # service ntpd restart
NTP再起動後から指定したディレクトリに統計情報ファイルが出力されるので確認する。
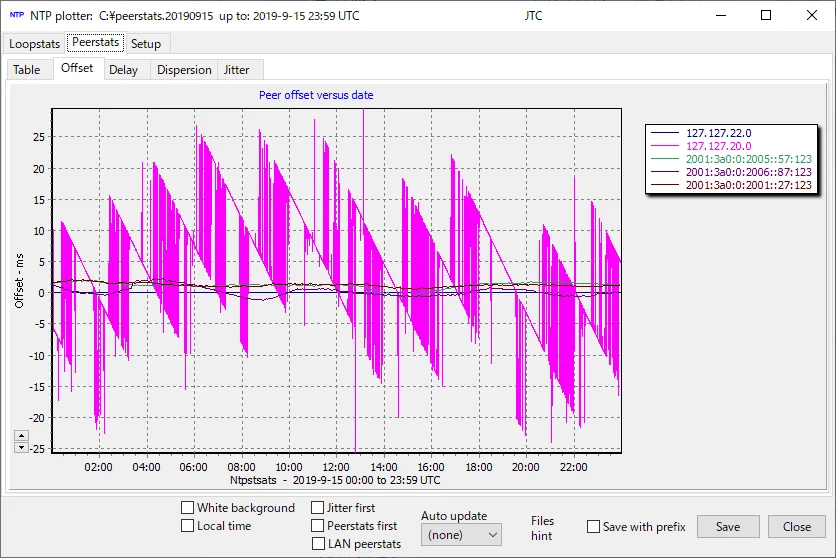
1日以上経って出力されたpeerstatsファイルをWindowsアプリのNTP plotterで表示してみた。
はっきり言ってこのアプリは動作が遅いのでpeerstatsファイルを選択してからグラフが表示されるまで時間がかかる。まぁこんな感じのグラフが表示されるようにしたいという例。ただし、グラフを見れば判るが、ネットの時刻ソースからPPSまで全て1つのグラフに入れるのはちょっとね。あと、この図ではNMEA(127.127.20.0)がノコギリの刃のようになっているがこれはおかしい。(このGPSモジュール1つだけがこんなグラフになるので個体の異常っぽい)
peerstats統計情報をNode Exporterに渡す
ファイル名は何でも良いと思うが/usr/local/bin/get_peerstats.shというスクリプトを作成した。
/usr/local/bin/get_peerstats.sh (新規作成)1 2 3 4 5 6 7 8 9 10 11 12 13 14 15 16 17 18 19 20 21 22 23 24 25 26 27 28 29 30 31 32 33 34 35 36 37 38 39 40 41 42 43 44 45 46 47 48 49 50 51 52 53 54 55 56 57 58 59 60 61 62 63 64 65 66 67 68 69 70 71 72 73 74 75 76 | #!/bin/sh
log="/var/lib/ntp/ntpstats/peerstats"
name="node_ntp_peerstats"
outdir="/tmp/node-exporter/"
#NTP Servers
srv1='2001:3a0:0:2001::27'
srv2='2001:3a0:0:2005::57'
srv3='2001:3a0:0:2006::87'
offset1="# HELP node_ntpstats_offset_seconds Time offset in between local system and reference clock."
offset2="# TYPE node_ntpstats_offset_seconds gauge"
delay1="# HELP node_ntpstats_delay_seconds Time delay in between local system and reference clock."
delay2="# TYPE node_ntpstats_delay_seconds gauge"
disps1="# HELP node_ntpstats_dispersion_seconds Time dispersion in between local system and reference clock."
disps2="# TYPE node_ntpstats_dispersion_seconds gauge"
skew1="# HELP node_ntpstats_skew_seconds Time skew in between local system and reference clock."
skew2="# TYPE node_ntpstats_skew_seconds gauge"
pps='127.127.22.0'
ppsdata=`/bin/cat ${log} | /bin/grep ${pps} | /usr/bin/tail -1`
ppsoffset=`echo ${ppsdata} | cut -d " " -f 5`
ppsdelay=`echo ${ppsdata} | cut -d " " -f 6`
ppsdisps=`echo ${ppsdata} | cut -d " " -f 7`
ppsskew=`echo ${ppsdata} | cut -d " " -f 8`
ppsl1="node_ntpstats_offset_seconds{device=\"pps\"} ${ppsoffset}"
ppsl2="node_ntpstats_delay_seconds{device=\"pps\"} ${ppsdelay}"
ppsl3="node_ntpstats_dispersion_seconds{device=\"pps\"} ${ppsdisps}"
ppsl4="node_ntpstats_skew_seconds{device=\"pps\"} ${ppsskew}"
nmea='127.127.20.0'
nmeadata=`/bin/cat ${log} | /bin/grep ${nmea} | /usr/bin/tail -1`
nmeaoffset=`echo ${nmeadata} | cut -d " " -f 5`
nmeadelay=`echo ${nmeadata} | cut -d " " -f 6`
nmeadisps=`echo ${nmeadata} | cut -d " " -f 7`
nmeaskew=`echo ${nmeadata} | cut -d " " -f 8`
nmeal1="node_ntpstats_offset_seconds{device=\"nmea\"} ${nmeaoffset}"
nmeal2="node_ntpstats_delay_seconds{device=\"nmea\"} ${nmeadelay}"
nmeal3="node_ntpstats_dispersion_seconds{device=\"nmea\"} ${nmeadisps}"
nmeal4="node_ntpstats_skew_seconds{device=\"nmea\"} ${nmeaskew}"
srv1data=`/bin/cat ${log} | /bin/grep ${srv1} | /usr/bin/tail -1`
srv1offset=`echo ${srv1data} | cut -d " " -f 5`
srv1delay=`echo ${srv1data} | cut -d " " -f 6`
srv1disps=`echo ${srv1data} | cut -d " " -f 7`
srv1skew=`echo ${srv1data} | cut -d " " -f 8`
srv1l1="node_ntpstats_offset_seconds{device=\"${srv1}\"} ${srv1offset}"
srv1l2="node_ntpstats_delay_seconds{device=\"${srv1}\"} ${srv1delay}"
srv1l3="node_ntpstats_dispersion_seconds{device=\"${srv1}\"} ${srv1disps}"
srv1l4="node_ntpstats_skew_seconds{device=\"${srv1}\"} ${srv1skew}"
srv2data=`/bin/cat ${log} | /bin/grep ${srv2} | /usr/bin/tail -1`
srv2offset=`echo ${srv2data} | cut -d " " -f 5`
srv2delay=`echo ${srv2data} | cut -d " " -f 6`
srv2disps=`echo ${srv2data} | cut -d " " -f 7`
srv2skew=`echo ${srv2data} | cut -d " " -f 8`
srv2l1="node_ntpstats_offset_seconds{device=\"${srv2}\"} ${srv2offset}"
srv2l2="node_ntpstats_delay_seconds{device=\"${srv2}\"} ${srv2delay}"
srv2l3="node_ntpstats_dispersion_seconds{device=\"${srv2}\"} ${srv2disps}"
srv2l4="node_ntpstats_skew_seconds{device=\"${srv2}\"} ${srv2skew}"
srv3data=`/bin/cat ${log} | /bin/grep ${srv3} | /usr/bin/tail -1`
srv3offset=`echo ${srv3data} | cut -d " " -f 5`
srv3delay=`echo ${srv3data} | cut -d " " -f 6`
srv3disps=`echo ${srv3data} | cut -d " " -f 7`
srv3skew=`echo ${srv3data} | cut -d " " -f 8`
srv3l1="node_ntpstats_offset_seconds{device=\"${srv3}\"} ${srv3offset}"
srv3l2="node_ntpstats_delay_seconds{device=\"${srv3}\"} ${srv3delay}"
srv3l3="node_ntpstats_dispersion_seconds{device=\"${srv3}\"} ${srv3disps}"
srv3l4="node_ntpstats_skew_seconds{device=\"${srv3}\"} ${srv3skew}"
echo "${offset1}\n${offset2}\n${ppsl1}\n${nmeal1}\n${srv1l1}\n${srv2l1}\n${srv3l1}\n${delay1}\n${delay2}\n${ppsl2}\n${nmeal2}\n${srv1l2}\n${srv2l2}\n${srv3l2}\n${disps1}\n${disps2}\n${ppsl3}\n${nmeal3}\n${srv1l3}\n${srv2l3}\n${srv3l3}\n${skew1}\n${skew2}\n${ppsl4}\n${nmeal4}\n${srv1l4}\n${srv2l4}\n${srv3l4}" > ${outdir}${name}.prom.$$
/bin/mv ${outdir}${name}.prom.$$ ${outdir}${name}.prom
/bin/chmod 666 ${outdir}${name}.prom
|
ボーンシェルのスクリプトにしたのは、BSD/Linuxほぼ全ての環境でも動くから。Linuxだと/bin/shの実体はdashが多いようだけど、問題なく動く筈。
変数を${変数名}形式にしてるのは編集のときにわかりやすいから。
やってることは単純でpeerstatsファイルから各時刻ソースの最新行1行を取得して、空白文字で分割して目的の数値を得るというもの。最新レコードの時刻突合はボーンシェルだと難しくなるのでパスというインチキだけど、ntpdが動いていて正しく時刻ソースから情報が得られている限りは特に問題ない筈。
PPSが無いNTPサーバの場合、PPS関係の記述を全て消してください。特に最後近くのecho行の${pps*}\nを全て。
外部の時刻参照サーバが2つの場合はSRV3関係を全て消してください。特に最後近くのecho行の${srv3*}\nを全て。
でないと、Node Exporter的には不適切なデータが出力されてしまう。
xBSDでは\nによる改行がおそらく利用できないので\nの代わりに改行してください。ダブルクォーテーションの中で改行したらそれが反映されます。また、xBSDではgrepが/bin/grepではなく/usr/bin/grepだと思われるので上のようにフルパス指定の場合は要修正。
Node Exporterが読み込む外部ファイルのディレクトリはoutdir変数で指定しています。
前回と同じなら /tmp/node-exporter です。
FreeBSDのports/pkgでNode Exporterをインストールしている場合は外部参照ディレクトリが /usr/local/etc/rc.d/node_exporter内で /var/tmp/node_exporter に指定されているのでスクリプト4行目のoutdir変数の値を/var/tmp/node_exporterにしてください。または/etc/rc.confで
node_exporter_textfile_dir="好みのdir"行を追加してそこで指定したディレクトリにします。このようになっているので/etc/rc.confのnode_exporter_args行で --collector.textfile.directory=hoge は指定するとエラーになります。Node Exporterが即死するので絶対NGです。
$ sudo chmod +x /usr/local/bin/get_peerstats.sh
/etc/crontab (1行追加)
* * * * * root /usr/local/bin/get_peerstats.sh >/dev/null 2>&1
cronで1分ごとに実行するようにする。
出力内容の確認
Node Exporterを再起動する必要があるかは不明。「がとらぼ」の中の人は躊躇なく再起動したので外部ファイル追加時の挙動を確認していない。
http://node_exporterホスト:9100/metrics を確認する。
出力されるデータの何処かに以下のような内容が含まれていたらOK
# HELP node_ntpstats_delay_seconds Time delay in between local system and reference clock.
# TYPE node_ntpstats_delay_seconds gauge
node_ntpstats_delay_seconds{device="2001:3a0:0:2001::27"} 0.011966835
node_ntpstats_delay_seconds{device="2001:3a0:0:2005::57"} 0.012230173
node_ntpstats_delay_seconds{device="2001:3a0:0:2006::87"} 0.011432178
node_ntpstats_delay_seconds{device="nmea"} 0
node_ntpstats_delay_seconds{device="pps"} 0
# HELP node_ntpstats_dispersion_seconds Time dispersion in between local system and reference clock.
# TYPE node_ntpstats_dispersion_seconds gauge
node_ntpstats_dispersion_seconds{device="2001:3a0:0:2001::27"} 0.002332928
node_ntpstats_dispersion_seconds{device="2001:3a0:0:2005::57"} 0.00157883
node_ntpstats_dispersion_seconds{device="2001:3a0:0:2006::87"} 0.00320245
node_ntpstats_dispersion_seconds{device="nmea"} 0.000237624
node_ntpstats_dispersion_seconds{device="pps"} 0.000235834
# HELP node_ntpstats_offset_seconds Time offset in between local system and reference clock.
# TYPE node_ntpstats_offset_seconds gauge
node_ntpstats_offset_seconds{device="2001:3a0:0:2001::27"} 0.000939802
node_ntpstats_offset_seconds{device="2001:3a0:0:2005::57"} 0.001022241
node_ntpstats_offset_seconds{device="2001:3a0:0:2006::87"} 0.000583119
node_ntpstats_offset_seconds{device="nmea"} -0.00125271
node_ntpstats_offset_seconds{device="pps"} 1.1725e-05
# HELP node_ntpstats_skew_seconds Time skew in between local system and reference clock.
# TYPE node_ntpstats_skew_seconds gauge
node_ntpstats_skew_seconds{device="2001:3a0:0:2001::27"} 0.000138265
node_ntpstats_skew_seconds{device="2001:3a0:0:2005::57"} 0.000146675
node_ntpstats_skew_seconds{device="2001:3a0:0:2006::87"} 0.000125755
node_ntpstats_skew_seconds{device="nmea"} 0.000134344
node_ntpstats_skew_seconds{device="pps"} 1.3283e-05
Grafanaでグラフ表示
Grafanaの側は、何か適当にダッシュボードを造るか、既存のダッシュボードを使うかして、そこにグラフを追加してクエリーを書いて表示周りをチョイチョイですぐ表示できるのでとても簡単。
で、Node ExporterのNTPコレクタ機能で得た情報をGrafanaに表示するダッシュボードがhttps://grafana.com/grafana/dashboards/7496で入手できるが、使ってみた限りでは外部の時刻ソースとのズレを表示するようなことができない?POOLだけ?表示される情報の意味もちょっとよくわからない。そもそもNode Exporterが取得するNTP情報というのが何の情報なんだかわからないという・・・
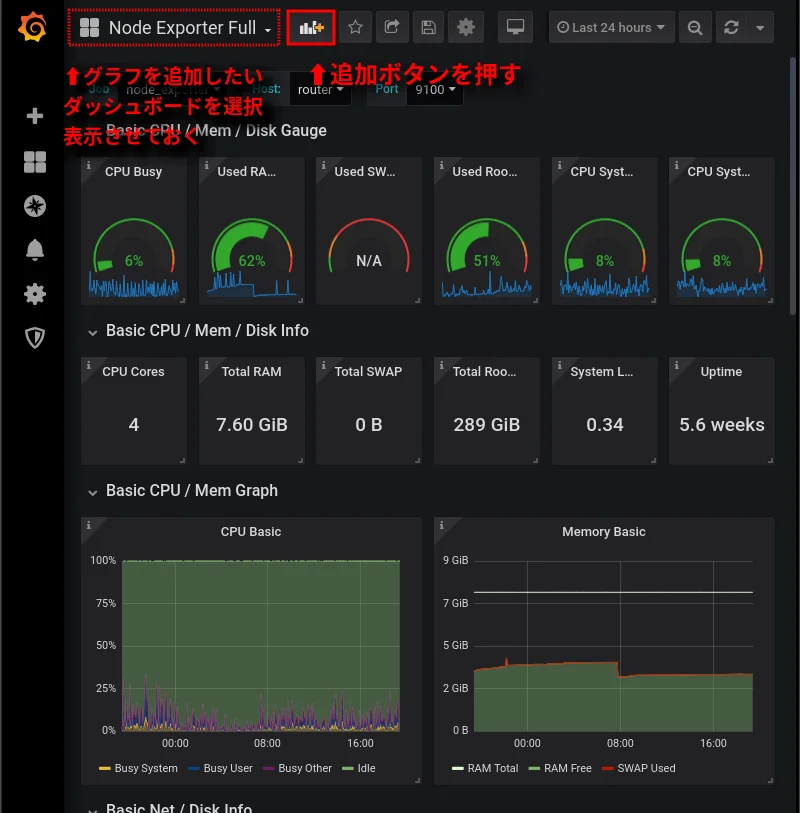
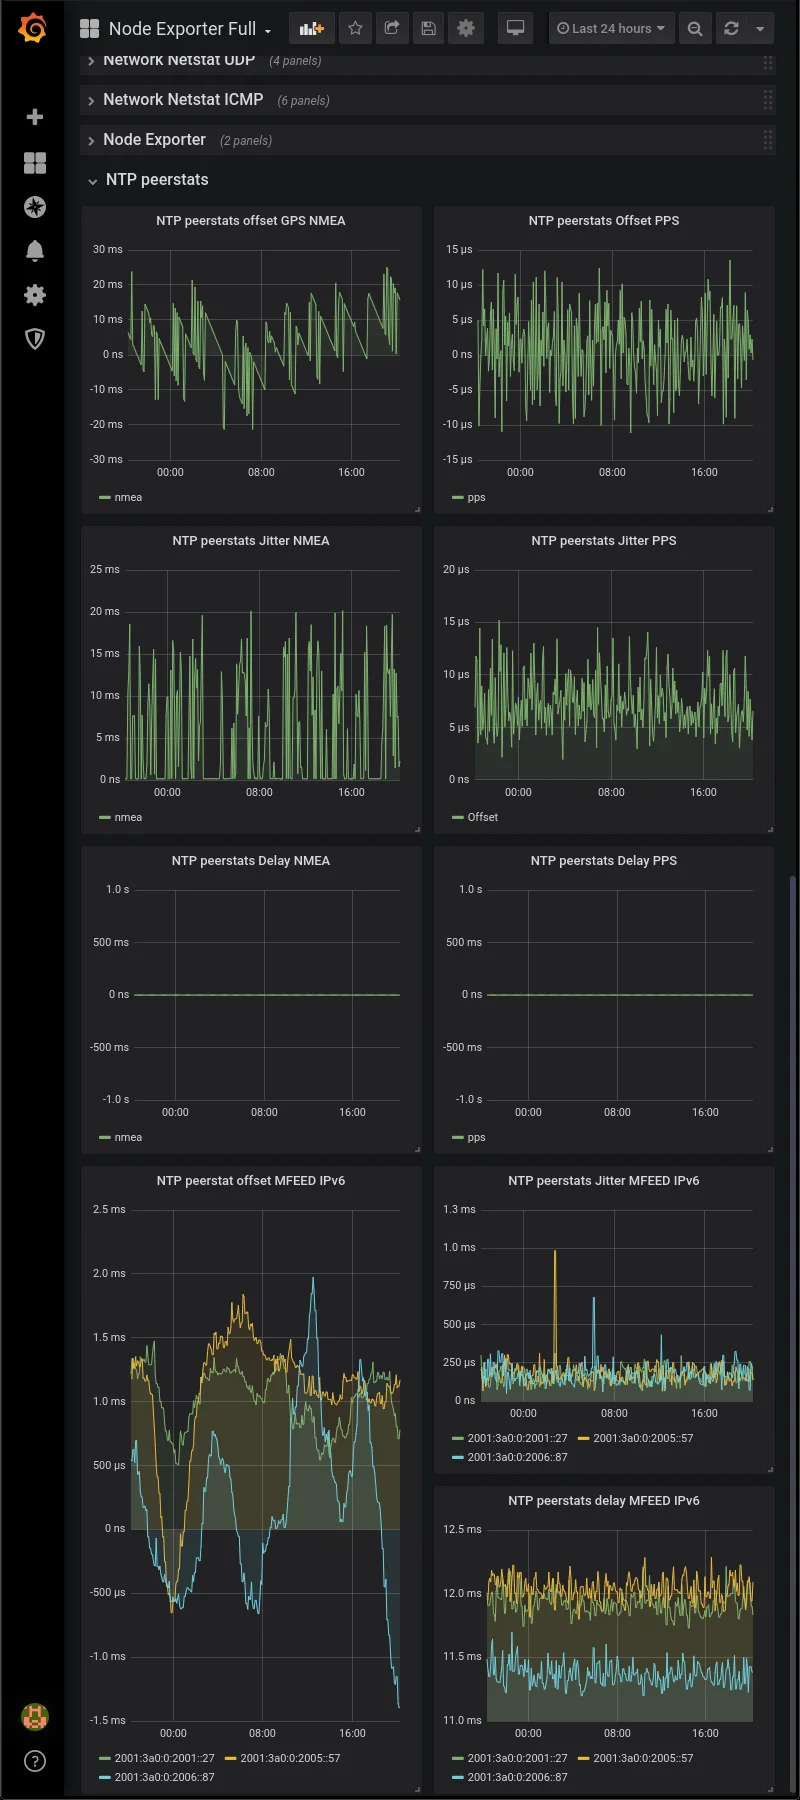
今回は、新しいダッシュボードではなく、以前に紹介したNode Exporter用のダッシュボードNode Exporter Fullにパネル(グラフ)を追加する形にする。ダッシュボードを切り替えなくて済むというのが「がとらぼ」の中の人の好みなので。
Grafana画面1:
Grafanaのダッシュボードを作成するか既存のダッシュボードを選択するなど、NTP統計情報を表示するパネル(グラフ)を追加するダッシュボードを表示した状態にする。
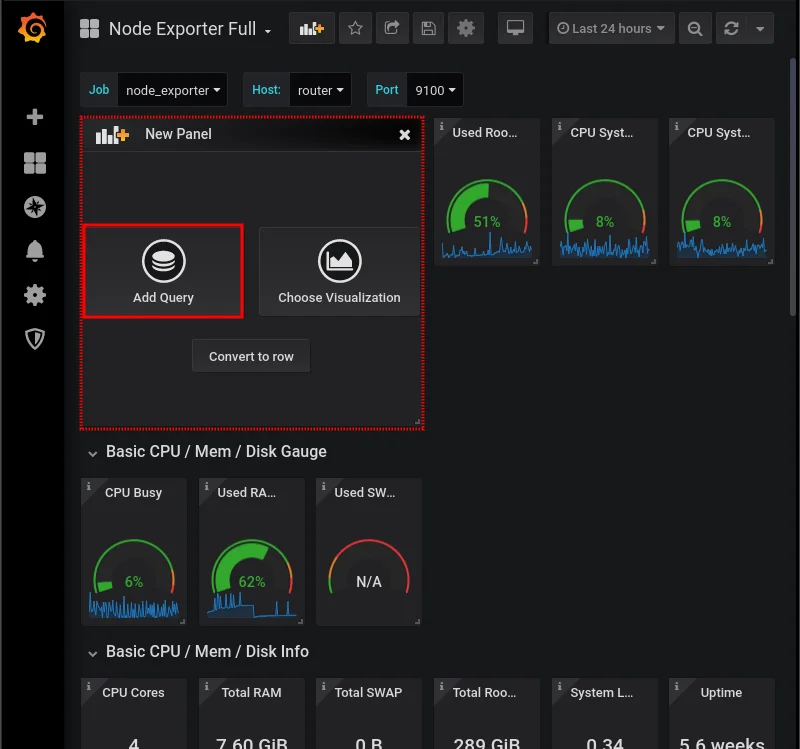
追加ボタンを押す。
Grafana画面2:
ダッシュボードの左上に新しいパネルが追加される。
そのパネルに表示されている「Add Query」をクリックする。
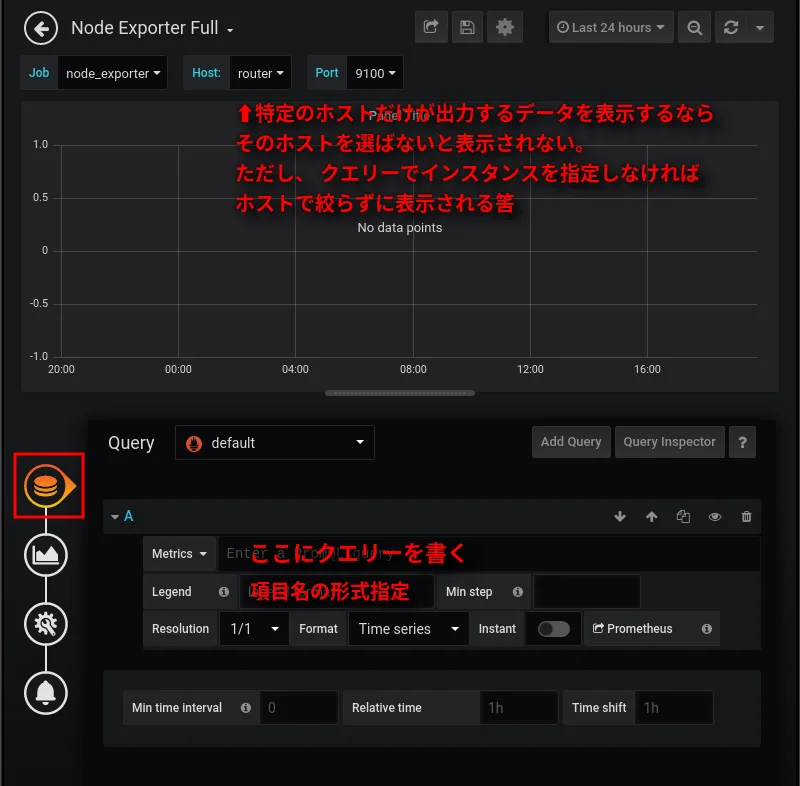
Grafana画面3:
クエリー設定画面が開くのでMetrics欄にクエリーを書く。
クエリーを書くと基本的にはリアルタイムに上のグラフ欄にクエリーに対応したグラフが表示される。ただし、実際にはフォーカスを変更するなどしないと更新されないかも。また、インスタンスを指定した場合はそのデータが存在するホストを選択しておかないとグラフ欄には何も表示されない。インスタンスを指定しなければホストで絞られないのでグラフが表示されるかもしれないが、そのグラフは複数のホストのデータが混ざっているかもしれない。
Legendの欄は未指定だとクエリーに近いものが表示される。グラフの線が何を表示しているのか等を表示するものなので例えばデバイス名などを表示すると良い筈。(次)
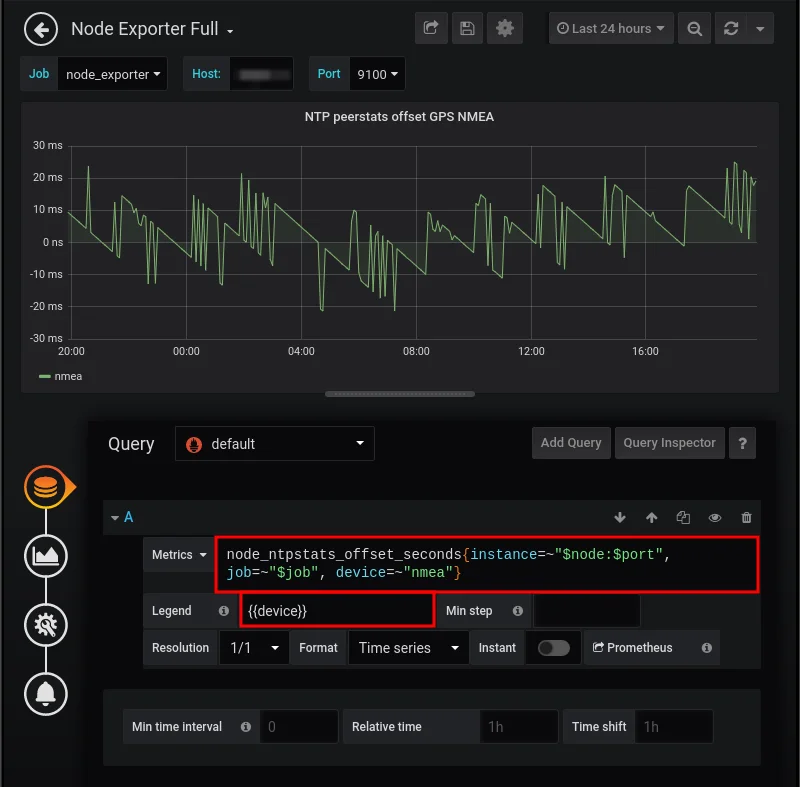
Grafana画面4:
1つの例としてNMEAのOffsetを表示するクエリー。
node_ntpstats_offset_seconds{job=~"$job", device="nmea"}
これでホストで絞らない状態。
node_ntpstats_offset_seconds{instance=~"$node:$port", job=~"$job", device="nmea"}
これで、ホストで絞られる状態。(上の画像の状態)
Legendは今回であれば、「 {{device}} 」のように指定する。 これで対応するデバイス名が代入される。
Grafana画面5:
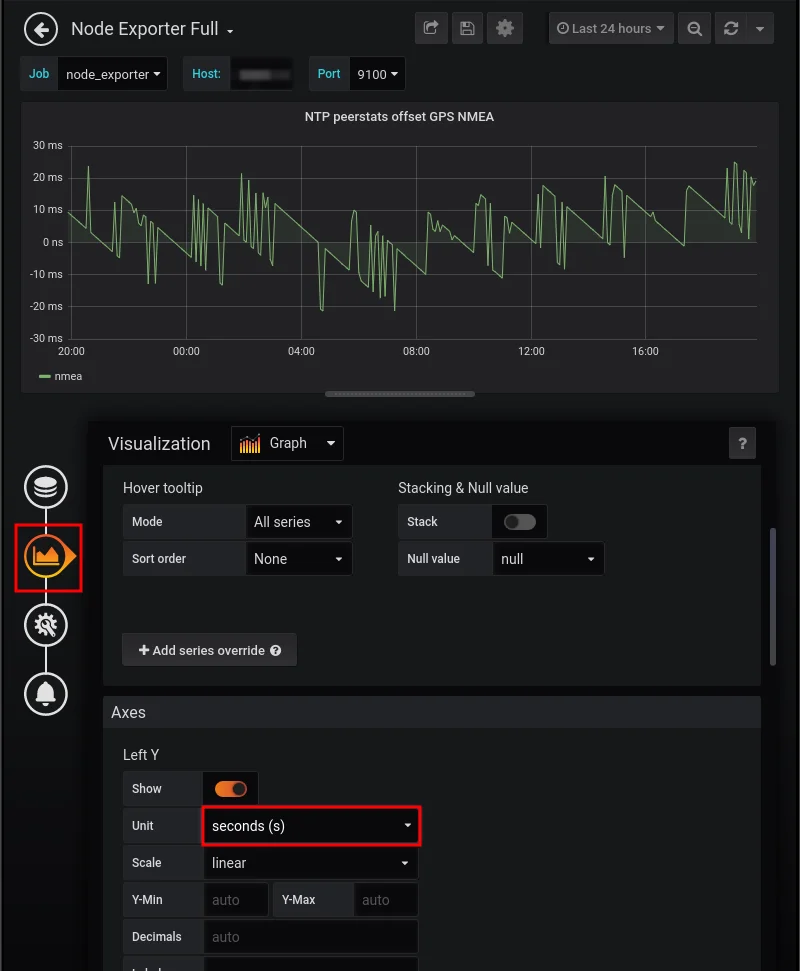
左から「グラフ」(Visualization)のアイコンを選ぶ。
Axesの中のLeft Yにある単位の種類(Unit)を選択する。今回のpeerstatsは数値の単位が「秒」なので、プルダウンメニューから「Time」サブ項目を選び、さらに下の「Seconds(s)」を選択する。
Grafana画面6:
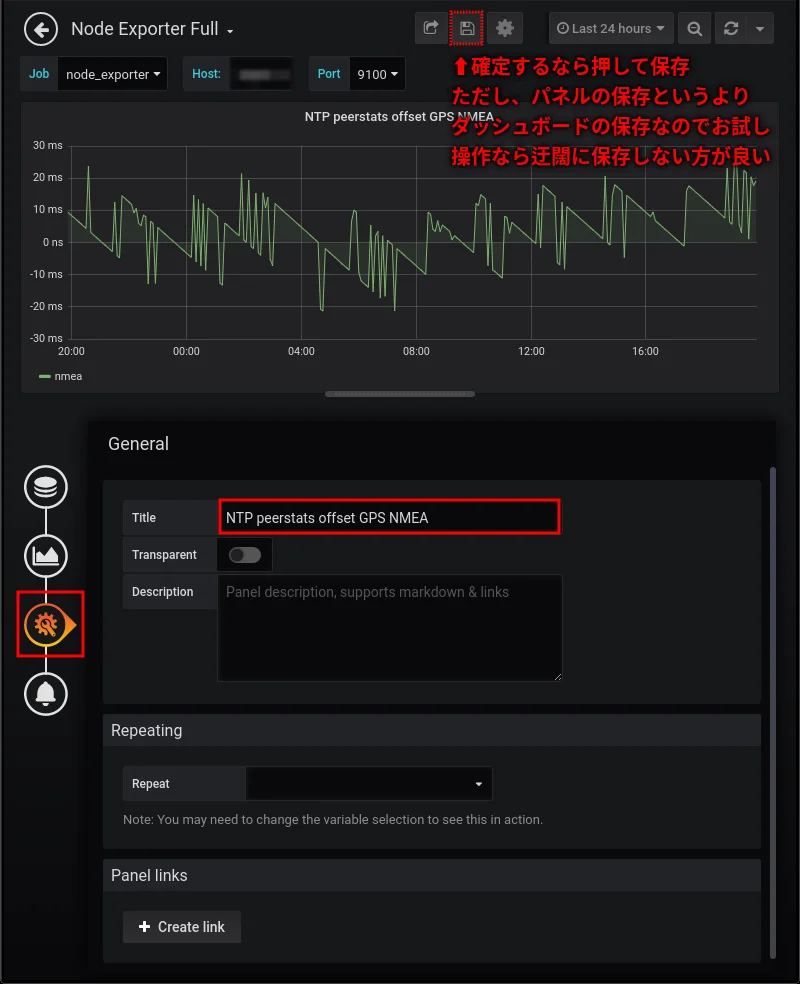
左から「歯車+スパナ」(General)のアイコンを選ぶ。
「Title」欄にグラフの名前を入力する。(任意)
そこまでで、確定するなら最上部のFDアイコンをクリックして保存する。クリックすると、入力窓が開くが、メモの入力欄なので特に入力しなくても良くて「Save」ボタンを押す。
なお、この保存はパネル単体ではなくダッシュボード全体の保存なので違うダッシュボードを表示しようとするまでに保存すれば良い。
また、パネルの位置を変えるなど何らかの変更を行ったらダッシュボードを出る際に保存するか確認される。迂闊な操作は保存しない方が良い場合も多い。
Grafana画面7:
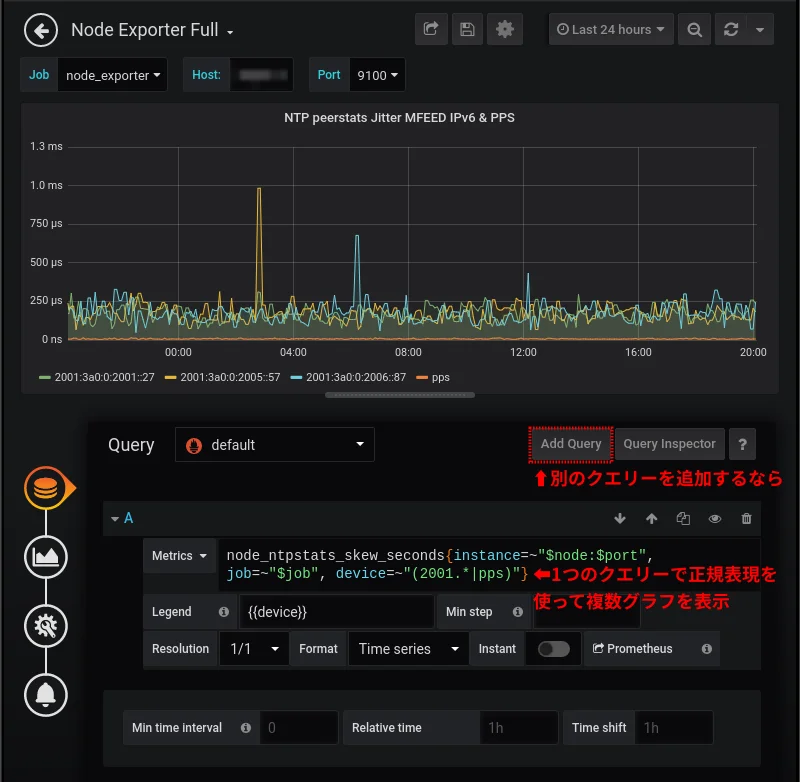
1つのパネルに複数のグラフ(折れ線やバー等)を表示する場合、複数のクエリーを追加するという方法があり、その場合は「Add Query」ボタンを押して、別のクエリーを登録する。
または、1つのクエリーで正規表現を使って必要なグラフを選択表示することもできる。
この画面の例では、「デバイス」で正規表現を使って「2001」から始まるIPv6アドレス全てを意味する「2001.*」または「pps」デバイスを表示させる「(A | B)」という形式で「(2001.*|pps)」を指定。
Grafana画面8:
好きなだけパネルを追加してPeerstats関係のグラフを作った。この画像はブラウザの窓幅を800pxに狭めているので貧相なグラフになっているが、幅を広げるともう少し見ごたえのあるグラフになる。
- dump1090 Prometheus ExporterでADS-B受信状況を監視する
- Grafana AlertingやAlert Managerと連携して警告灯を点灯
- Prometheus2とGrafana6によるシステム監視 GrafanaのAlertを使う
- Prometheus2によるシステム監視 FreeBSD標準のエクスポーター prometheus_sysctl_exporterを使う
- Prometheus2とGrafana6によるシステム監視 NTP統計情報の表示
- Prometheus2とGrafana6によるシステム監視 シングルボードコンピュータの温度表示
- Prometheus2とGrafana6によるシステム監視 FreeBSDのメモリとCPU温度
- Prometheus2とGrafana6によるシステム監視 Node Exporterの情報を表示
- Prometheus2とGrafana6によるシステム監視